Thursday, March 15, 2012

Broad Street Pumps: Use of imagery to save lives

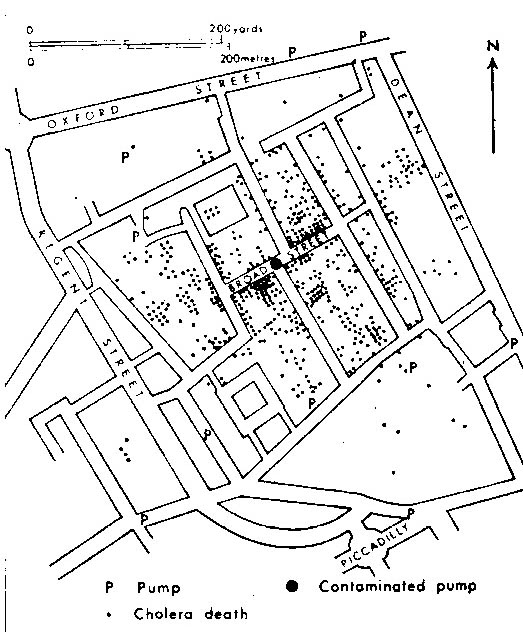
Imagery can help anyone learn something better. For example, if you want to explain what to do when someone has a deep cut, but it is not the same as seeing a picture of how the tourniquet should look like when you are finished. Images can help you convey complex ideas in a short period of time, and to incite action in the viewers... one place that imagery has been effective is in the case of disease transmission  Diseases come in many different shapes and forms... especially when it comes to transmission. But one event always sticks out when I think of Epidemiology: John Snow and the Broad Street Pump.


Soho, England 1854
Cholera is one of the deadliest diseases at the time, wiping out entire households overnight. There was seemingly no rhyme or reason to the attacks, why one household was effective and another was spared. Was one family or person more righteous than another? Or perhaps the citizens of Soho had angered God and called this plight against themselves.

One man had brilliant idea. He took a map of Soho and marked exactly where each attack of Cholera hit. as he looked at his map for an idea of what might be causing the disease (a novel idea for the time period) he noticed that the water pump on broad street seemed to be the epicenter of the attacks.


He brought his maps and graphs to the authorities of Soho to show them how to stop the Cholera. The authorities were reluctant, but they were able to see that it was necessary to remove the handel. (albeit once the disease was gone, they put the handel back on the pump... fortunately Cholera doesn't stick around a water supply without a host source)

Images are important to help convey important ideas.

Monday, March 12, 2012

Staying away from the Yellow: a quick guide for info graphics

One of the many things that interested me when I was in Highschool was Journalism. I had been accidentally placed by the school system in a TV production class (I signed up for a Jewelry class, go figure). One of the first things we learned in this class was about what not to do with our journalism by reading about the yellow journalists.
These journalists used their opinions (or the opinions of others) as absolute fact, something that could easily change how things work. Now one of the things I have been working on for the project is trying to help the groups to develop good infographics... the key word being 'info'.

How do we choose information to present in an info graphic? First it needs to be pertinent. If we are making a graphic about The Church of Jesus Christ of Latter-Day Saints, for example, we may have information regarding how many members are on Facebook on a daily basis... but if we are trying to get information out on what the church believes that information is rather useless. You would be better to see if you can get information on how many members take sacrament each week, or maybe how many attend church on a regular basis. Second, the information needs to have reliable sources. Just like any research article you write for class the infographics that you produce need to have reliable sources for the information that you portray... Wikipedia and some websites have plenty of inaccurate information on the beliefs of the Church (I'm pretty certain that there are no human sacrifices in LDS Temples).Third, the information you share on the info graphic shouldn't be excessive. For example, if we are planning to share with people how laws are made, you need to decide how much information is needed to present it to people. This example is very thurough, but you loose the reader about 3 min in because the graphic is so cluttered with (admittedly useful) information that they don't really know what to do or where to read all of the information. Fourth, you need to have a flow. Humans like categories... if you just give them a list of information in a random order they are not going to remember it as well as when you order that information in groups or in a visual pattern. The flow dosen't have to be complicated... the example of the LDS infographic you see that they categorized the information and then put in a list form, complicated? No. Useful? Yes, you can still remember the information after you are done reading it.

With this said infographics are one of the most interesting ways to digest information for other people to use quickly. (Imagine if you college textbooks had put the information that you needed for the class in a simpel infographic for you to memorize) Hopefully this post helps people understand how to create a better infographic.

Thursday, March 8, 2012

A little note on image copyright

A little while ago we had a wonderful little film about copyright:

Now that was nice, however what does copyright mean for images?
In short: Everything. Because any image that you may see on the web may possibly be copyrighted. Unlike movies or music, there is no fair use for images, no matter how much you change or alter the image it still belongs to the copyright holder. (see US Copyright Law) So if you were to talk about 15 sec of video, like this movie does it is well within fair use. If you were to make a parody of a popular song, the same applies. Images are a little stickier, because the image's creator has the sole right to make derivatives of the work.

However there is a way to have images available for your blogs and papers, free from the irritation of copyright... there is something called "creative commons" where people are willing to put up their images with minimal limitations on their reproduction for people to use them. You can read more about the Creative Commons movement HERE and find creative commons images in many different locations such as Flickr, Corbis, and more if you look at google.

You can also find copyright free music at places like Freeplay, stock music, or more

Saturday, March 3, 2012

The importance of visualization

One of the hardest things in my life is finding the motivation to complete a certain task, especially when it is a creative project started by myself. Currently on my hard drive there are three songs that are half composed, no less than four novels in varying stages of disrepair and neglect, five comics that are half finished and just need to be inked, not to mention the countless articles that I wanted to write about deadly diseases that never got past the first draft...

I've been thinking a lot about why I finished one project (a novel) and not any of these others. I found that there is an interesting connection between deadlines and completion... but oddly enough the main reason I think that this project was completed was because I thought about it all the time because one of the main plot elements in the book were things that I physically dealt with on a daily basis... it was actually seeing the objects (or in this case actually talking a martial arts class and doing what the character could do)

Then I remembered my time as a microbiology TA for the intro level class... I talked to those students for hours and hours trying to explain a process that seemed simple to me... but it wasn't until I got fed up and just drew the procedure on the whiteboard. Indubitably, every time I drew the process they were confused about they figured out the problem. Forget about analogies to familiar every day things, as soon as I showed them a picture of what they needed to do it got done... and done well.

What other processes can be aided by visualization... whether it be physically doing something or just looking at a diagram. According to some graphic designers the visualization turns something as abstract as the Krebs cycle or the infection pattern of cryptosporidium into concrete details that the people can then intake in more than one part of their brain and enable them to do so much more. The chart here explains the many different chemical pathways that one could go through to see the different processes that could happen in a t-cell receptor, even showing the chemicals that are in common. Writing diagrams like this actually helped me do well in my cellular biology class because I could see where all the chemicals were and where they were going.
I wonder if as we create things and connect them visually if we will see more competent scientists who can make more creative adjustments... because in research, education is important, but sometimes education can be over rulled by creativity mixed with a little curiosity.

Wednesday, February 29, 2012

Where have all the Scientists gone?

I'm currently in a History of Microbiology class where I have the fun opportunity to learn where all the science I have been studying for the last couple of years has come from. One of the most interesting things I have noticed, not that we are studying the later microbiologists is how little is known about them.
Most people have hear of Pasteur and his vaccinations, or John Snow and the Broad Street pump, and if I were to mention Salk or Sabin many people's ears would still perk up. However as time goes forward we no longer see scientists in the forefront. If you were to ask the typical American today to name one famous scientist I bet you they would all mention Einstein... and he lived ages ago, did amazing things, but lived long ago. We forget about the scientists who save our lives every day... take for example Maurice Hilliman, no one's heard of him...but everyone who has been through the American school system has taken at least 6 of his vaccinations. Someone who helped stop deadly diseases like mumps, measles, and hepatitis B has never been mentioned in one substantial news broadcast...

Saturday, February 25, 2012

What's the Point?

OK, so I've had a couple of questions for myself recently and since Professors said that I should publish this random musing of a post I shall.
Why am I writing? What am I writing about? Do I really care about what I am saying? How am I making a digital fingerprint in life? Does making a digital fingerprint even matter for what is most important to me?

As I've perused my previous postings I have discovered some things...
1. I seem to have a psychological need to relate everything to science
2. My grammar needs a little more work to be professional grade.
3. I'm rather optimistic about the new possibilities available to us via new technology and such
4. I don't have any idea what my theme actually is.

Those discoveries aside, what am I actually interested in?

Is it open science? Studying how many different scientists can get together to accomplish more through cooperation. It intrigues me, but I'm still not sold on it.

Is it interconnections? Is is how life, the universe, and everything is connected via thousands of connections kind-of like own own biosystems? I have always been interested in understanding hw tying all of your subjects together would be a way of helping you learn better.

Is it the future? Well, I'm obviously interested in the future just about as much as everyone else, but it's not enough for me to write about the future... maybe in a creative writing blog or sommat.

But when I re-looked at my blogs I noticed an interesting little tendril of a underlying theme there... how action and more importantly participation improves life in general. I'll now have to get to work and beat the apathy out of my system, because as I treat this as a class assignment that no one will ever return to I become apathetic and don't care about what I am writing.

And it's like that with life, if you are posed with a problem that doesn't seem to make a difference if you solve it or just let it be. I want to look more into the benefits of participation, especially with the sciences because regular sciences do not allow for the general populace to take part, or even understand. I want to work on how science and technology can be made more open to the general populace to help them decrease their apathy towards life in general. Maybe I can awake the sheeple and help them become the future scientists of tomorrow.

Friday, February 24, 2012

Ideas from class brainstorm yesterday


1.     Main Topics
a.     Copyright—what it is what limits to openness
b.     Profits from digital content
                                               i.     Creating things for free
c.      Advantages and disadvantages of digital openness
d.     Organizations that choose to go open and how that has impacted everything
e.     How to make more thing open
f.      Fun theory and gamification
g.     Build up the good and scope trying to find broken things to fix
h.     How to get information that is accurate
i.        
2.     Digital Topic alongside with digital topics
a.     Russian revolution—limiting the rights of the people—closed societies—not right to own things and it fell apart
b.     French revolution—the lack of order in a society
c.      Open science and the scientists who made it possible what societal openness has to do with progression in science
d.     Internet—access to information from all over the world… what if the internet wasn’t free
e.     Exploration of new medium—for the crazy or the genius
3.     Why Should I care about my major
a.     Everything is built across the backs of giants
b.     Reach--- topic to a larger audience
c.      Approaches to education--- how we can open education even more in reform professors… and form freshmen